


PLANT HEALTH CARE Results for the year ended 31 December 2021
Transparency directive : regulatory news
|
DGAP-News: Plant Health Care
Results for the year ended 31 December 2021 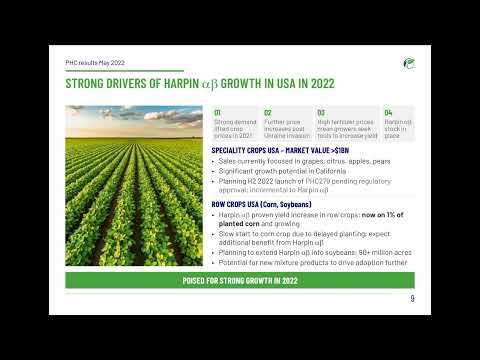 Released 07:00:05 12 May 2022 RNS Number : 1831L Plant Health Care PLC 12 May 2022
Results for the year ended 31 December 2021 By 2050 the world will need 60% more food Our products support sustainable food production by using nature to enable farmers to produce more from less land, whilst protecting soils and biodiversity and reducing reliance on chemical fertilizers.
• The market for biological products is growing at 12% per annum and is projected to be a $19 billion market by 2026. • Plant Health Care's core patented products act as "vaccines for plants", making plants healthier, better able to resist disease and stress, thereby improving crop yield and quality. • Sales of the Group's Harpin product increased by 55% in 2021, as market shares grew in core markets; the Commercial business is profitable and cash generative. • The Company has invested more than $25 million in PREtec, a powerful new platform technology, since 2012. • PREtec products are targeting markets worth more than $5 billion around the world. • The first PREtec product Saori™, was launched in Brazil in 2021, through our partner Nutrien, generating a very positive response from growers.
2021 highlights Commercial* • Revenue was $8.4 million (2020: $6.6 million), a 28% increase on the prior year, 24% in constant currency**. • Proprietary product revenue increased $2.2 million or 58% to $6.1 million (2020: $3.9 million). • The Commercial business was EBITDA and cash positive for the second straight year. • On-ground sales*** in Brazil and the USA increased 48% and 85%, respectively.
PREtec products • Successful launch of Saori™ in Brazil. • PHC949 was submitted for registration in the USA. • Low-cost manufacture of PREtec peptides was demonstrated at the pilot scale. • The Group has a rich pipeline**** from the PREtec platform. • PREtec is a patented platform technology, targeting $5 billion market opportunities. These 'vaccines for plants' use environmentally friendly peptides, derived from natural proteins, to make plants healthier and help growers produce larger yields and better quality crops.
Group • Cash used in operations increased to $3.2 million (2020: $2.5 million). • Adjusted LBITDA***** increased to $4.6 million (2020: $3.3 million). • Cash and cash equivalents including investments at 31 December 2021 were $9.2 million (2019: $4.1 million). • The Company successfully raised £6.6 million ($9.1 million) through the issuance of new ordinary shares in March 2021.
* The commercial business is defined as sales of our proprietary and third-party products to our global distributors in the Americas, Mexico and Rest of World markets. ** Constant currency is defined below. *** On-ground sales is defined as sales by our distributors to growers. **** Three additional peptides are expected to be launched between 2022 and 2024. The Group is also researching additional peptides in our Seattle lab. ***** Adjusted LBITDA: Loss before Interest, tax, depreciation, amortization, share-based payments and intercompany foreign exchange.
Richard Webb, Chairman comments: 2021 has been an excellent year of delivery against promise. The market for sustainable agriculture is growing at more than 12% per annum; Plant Health Care aims to grow faster than that market. Sustainability is at the heart of everything we do. Delivering Performance Plant Health Care delivered strong results in 2021, ahead of market expectations. We are resolved to set and achieve realistically ambitious targets each year; this is the start of a new trend. Sustainability The benign profile of our technology has long attracted investor attention. PHC applied for and gained the LSE's Green Economy Mark in 2021. This is gratifying, but in a sense it understates our case. We are world leaders in the use of biological signals to engage the natural powers of crop plants to protect themselves from stresses like drought or frost, and to defend themselves against pests and diseases. This is good not only for crop yields, plant health and harvest quality, but it also improves soil health, boosts carbon sequestration, and reduces the need for pesticides.
Since 2018, we have evolved our strategy from a focus on licensing our technology to major suppliers of agrochemicals, towards working with distributors. In the USA, we have been working with two of the four largest distributors since 2019; these relationships have developed into productive partnerships, combining sales of Harpin αβ today with collaboration to bring PREtec products to the market in 2022 and beyond. The addition of two more major distributor relationships in 2021 is a further important step in the development of this strategy. I am increasingly convinced that our distributor partners will drive the adoption of our technologies over the coming years, to the benefit of the farming industry as it seeks to adopt more sustainable practices.
PREtec - "Vaccines for Plants" I am immensely proud that we are now launching the first products. We are now confident of launching a new PREtec product every year in a major market, via a major distributor. This has required securing scale up production capability in house, and manufacturing capacity externally. In 2021 we installed pilot production capacity in our technology centre in Seattle, which supplied launch volumes of Saori™. We also signed a major biologicals manufacturer in the EU to supply both Harpin αβ and PREtec products at scale, and at a lower manufacturing cost.
Covid-19 The world had to cope with the continued pandemic throughout 2021. In Plant Health Care, both the Board and Executives adapted well to the use of remote working and I am delighted to say that everyone in the team stayed safe. At the same time, demand for our products remained buoyant and continued to grow; we are fortunate to be in an industry which was largely unaffected by the pandemic in 2021.
Ukraine The directors have been watching the heart-breaking situation happening in Ukraine. We anticipate the conflict to have no material impact on the Group's operations. The Group currently has no customers or manufacturers in Ukraine or Russia, and we do not anticipate any business dealings in the long-term with either of these countries.
People In the face of 2021's worldwide challenges, our people have been thriving. During the year, Christopher Richards, as CEO, stepped back from operational management to focus on strategy and investor relations. Operational management was substantially delegated to the very experienced hands of Jeff Tweedy (COO), who has been the architect of the Company's successful strategy of focusing on distributors. With his fellow Executive Director Jeffrey Hovey (CFO), supported by a very strong Executive Committee, Plant Health Care boasts outstanding leadership.
For further information, please contact: Plant Health Care plc Richard Webb, Non-executive Chairman Tel: +1 919 926 1600
Cenkos Securities plc - Nomad & Broker Tel: +44 (0) 20 7391 8900 Neil McDonald / Peter Lynch
Company website: www.planthealthcare.com
Chief Executive Officer's statement Dr Christopher Richards, Chief Executive Officer Accelerating performance
Plant Health Care's encouraging performance in 2021 demonstrated the strength of our competitive position. In our sector of sustainable products for agriculture, we have a unique combination of proven products, with low costs of goods and very strong market access. During the year, we launched Saori™, the first product from the PREtec platform, in which we have invested more than $25 million over the last eight years. Mid-term sales of Saori™ are now expected to exceed the entire current revenue of Plant Health Care today and we plan to follow that with at least one major product launch every year. Performing above expectations Revenue growth accelerated in 2021, with Harpin αβ sales up 55%, lifting overall sales growth to 28% (24% in constant currency). The Commercial business remains profitable and cash generative. We invested $3.0 million in the PREtec platform, focused on obtaining registrations and refining manufacturing costs to support our plan for at least one major product launch every year, starting with the launch of Saori™ in Brazil in 2021. Stronger balance sheet We were very pleased to receive the support of shareholders for a fundraise in March 2021, raising $9.1 million (net of costs). With that improved funding, we increased investment in PREtec product launches during 2021. As a result, the Company increased the rate of cash burn to $4.1 million. At the end of 2021, our cash reserves were $9.2 million. We are confident that Plant Health Care will reach profit within these cash reserves. Accelerating commercial sales Sales of our core Harpin αβ product were up 55% in 2021, at a gross margin of 70%. This growth is testament both to the outstanding grower benefits of the product and to the strength of our market access. Our suite of distribution partners was widened to include Nutrien, the world's largest agriculture retailer, in Brazil and market leader Agrii in the UK. We now have close relationships with four of the world's largest distributors of agriculture inputs; in total, we have access to some 52 million hectares of crops, with a $5 billion set of opportunities. Our three largest customers for Harpin αβ each bought more than $1 million worth in 2021. Sales of Harpin αβ in the USA reached $2.8 million, as in-market sales into corn and specialty crops (fruits and vegetables) accelerate. In-market sales into specialty crops since 2019 have grown at 116% CAGR and we anticipate continued growth at this level. In Brazil, Harpin αβ sales reached $1.0 million; in-market sales into sugar cane have grown at 103% CAGR since 2019. Sales in our Europe/Africa/Asia region reached $1.6 million. The launch of Saori™ - the first "Vaccine for Plants" After eight years of research and development, we were excited to launch our first PREtec product, Saori™, in Brazil in September 2021. Saori™ promotes healthy growth of soybeans and helps them fight disease; Brazilian soybean growers spent $2.5 billion on fungicides to control disease in 2021, so this is a huge opportunity for Saori™. With limited volume of product available, we focused on demonstrating the benefits of Saori™ in 2021; approximately 250 farmers tested the product and the reaction was enormously positive. Our partner Nutrien is planning to sell Saori™ on more than 300,000 hectares in 2022, which will result in sales well in excess of $0.75 million for PHC in 2022. Nutrien is targeting sales of more than 1 million hectares in 2025. With commercial production now established, we are confident that Saori™ will generate gross margins at least comparable to those we currently enjoy with Harpin αβ and we have the capacity to supply all forecast global demand and more. PREtec product pipeline Following an investment of more than $25 million over the last eight years, we now have a full pipeline of major product launches. The next launch will be PHC279 in the USA; we anticipate regulatory approval in the second half of 2022 and are making detailed plans with our partner Wilbur-Ellis to launch before the end of the year. We have submitted PHC949 for registration in the USA and anticipate that this will be launched in 2023, subject to receiving regulatory approval. Registration of PHC949 in Brazil will follow. Each of these products has potential to generate revenues in excess of $5 million within the next 5 years, at gross margins comparable to those of Harpin αβ. People and sustainability Plant Health Care is fortunate to have a very strong team, with extensive experience and a track record of value creation. I am particularly proud of the way in which the global team operated in 2021, under the leadership of Jeff Tweedy. Learnings are being shared around the world, which will accelerate the growth of Harpin αβ. The team worked exceptionally well in 2021; buoyed by a successful year, everyone is excited about continuing this trajectory over the coming years. Sustainability is at the heart of everything we do at Plant Health Care; it is as motivational for our colleagues as we expect it to be mandatory for our investors. Summary and outlook We have set out ambitious plans for organic growth, with revenue exceeding $30 million in 2025. By that time, we expect to be generating strong profit and cash flows. The performance in 2021 was an important step along that road. As we roll out PREtec products, we anticipate that sales growth in 2022 and beyond will be even faster than in 2021. Strengthening our position in Europe, the world's largest market for sustainable agriculture, is an important element in our strategy. Constant currency We evaluate our results of operations on an as reported and constant currency basis. The constant currency presentation, which is a non-IFRS measure, excludes the impact of fluctuations in foreign currency exchange rates. We believe providing constant currency information provides valuable supplemental information regarding our results of operations, consistent with how we evaluate our performance. We calculate constant currency percentages by converting our prior-period local currency financial results using the current period exchange rates and comparing these adjusted amounts to our current period reported results.
Commercial business Potential for significant revenue growth
Overall sales in 2021 were $8.4 million, an increase of 28% (24% in constant currency*) compared with 2020 ($6.6 million). Sales by region are listed in the table below:
Sales of core Harpin αβ products increased by 55% (53% in constant currency), driven by sales of greater than $1.0 million each to three of our distribution partners. Harpin αβ represented 71% of sales in 2021 (2020: 59%). North America Sales in North America were up 67%, led by support from our two distribution partners in USA corn and specialty crops. Sales in USA corn were up 133% in 2021, driven by strong demand for the Group's Harpin αβ seed treatment product. Harpin αβ use in corn continues to deliver higher yields due to stronger corn plants that are protected from stress. In-market sales to growers are now approaching 1% of the USA corn market of 92 million acres. EPA registration of PHC279 is expected in Q3 2022 with a limited launch planned for Q4 2022 through our distribution partner Wilbur-Ellis. Harpin αβ sales in the USA specialty crop market were up 42%, in part due to sales growth in cherries, apples, and pears and a 143% increase in on-ground sales to growers. Wilbur-Ellis has over 600 field employees who are focused on selling differentiated biostimulant product offerings into the specialty crop markets. Employ® helps the plant improve its own natural ability to defend against abiotic and biotic stress factors, including nematodes, which improves overall crop yield. South America Sales of Harpin αβ for PHC in Brazil sugarcane grew 108% even under challenging drought conditions in 2021. Sugar cane growers experienced extreme drought during the 2021 growing season which reduced yield by more than 13%. Even under these conditions, Harpin αβ reinforced the benefits with yield increases greater than 23%. The Group received registration for Harpin αβ in Argentina for use in corn and soybeans in August 2021 with first year sales planned for the 2022 cropping season. In September 2021, the Group announced a major milestone by forming a partnership with the world's largest agricultural distributor, Nutrien, for the exclusive distribution of Saori™ as a seed treatment in soybeans for Asian soybean rust control. Saori™ is the Group's first product from its PREtec platform to be commercialized and is the first PREtec peptide approved in Brazil. PREtec peptides represent a novel class of technology which stimulates the plant to defend itself. Nutrien has a goal to build a differentiated biological portfolio and the addition of Saori™ is a major step in that direction. Derived from natural proteins, PREtec is an environmentally friendly approach to protecting crops and is compatible with mainstream agricultural practices. Brazil is the world's leading soybean producer with more than 40 million hectares (99 million acres) expected to be planted in the 2021/22 season. Asian soybean rust, caused by the fungus Phakopsora pachyrhizi, is a devastating disease which can lead to crop yield loss of up to 90%. Brazilian soybean farmers spent $2.85 billion on disease control in the 2019/20 season. EMEAA 2021 sales in the EMEAA region were up 31% with growth in Spain and the UK. Sales growth in Spain was driven by Harpin αβ sales into citrus and expansion into the greenhouse market. The Group signed an exclusive Harpin αβ distribution agreement with UK market leader Agrii in July 2021. UK sales growth was driven by the return of the amenity (turf) market and increased Harpin αβ sales into potatoes. Mexico Plant Health Care Mexico has a broad biological product line for farmers in Mexico including third-party products. Harpin αβ represented 23% of sales in 2021, with third-party products making up the remainder. Sales of Harpin αβ in Mexico grew 15% in 2021. Mexico continues to be Plant Health Care's largest business unit. Revenue from the Mexican business decreased 8% (12% in constant currency) to $3.0 million (2020: $3.2 million). This was primarily due to decreased export demand for fruits and vegetables and reduced plantings in the specialty market. The decreased export demand resulted in up to 50% reduction in planted fruit and vegetable crops. However increased plantings of fruits and vegetables resumed in Q4 2021. PHC Mexico completed the first trials in agave and avocado with positive results in 2021 which will open new markets in the coming years. New technology
PREtec peptides: poised to enter large markets
PREtec PIPELINE The PREtec technology platform is proving to be a reliable source for new products. The pipeline is poised to launch one new PREtec product each year going forward. All PREtec peptides are variants of naturally occurring proteins and break down rapidly in the environment, leaving no harmful residues on the crop or in the environment. The Group has a long history of offering products that support agricultural and environmental sustainability. The new products described below continue to meet the highest standards of sustainability. USA The Company is on track to launch PHC279 (the active ingredient in Saori™) in the USA in partnership with Wilbur-Ellis (the fourth largest crop inputs provider in the USA) before the end of 2022. Regulatory approval from the EPA is being pursued. The launch with Wilbur-Ellis will be focussed on growers of speciality crops - fruits, vegetables, and tree nuts. Foliar applications will enable these high value crops to resist losses in crop yield and quality associated with destructive plant diseases. By applying PHC279, producers will be able to ensure a high-quality crop while reducing their reliance on older, higher use-rate, synthetic fungicides, which are associated with leaving residues after harvest and having adverse environmental impacts. A new liquid formulation of PHC279 has been developed, which is optimised for use as a seed treatment in row crops like corn and soybeans. This is expected to gain EPA approval in late 2023. The Group is confident that formulations of PHC279 represent a multi-million-dollar revenue opportunity in USA markets. Knowledge gained from these product launches will be leveraged with strategic partners to identify new countries and additional high value markets where these products can be introduced. During 2021, following in the tracks laid by PHC279, we have been preparing to file a regulatory submission for a product based on PHC949. This was filed with the EPA in January 2022. The new PHC949 product prevents yield loss from nematode (soil pests) damage in a wide range of crops. Nematode control products are forecast to be worth $1.6 billion globally by 2025; these pests reduce crop yields by some $100 billion annually. In the USA, PHC949 will be co-developed with Wilbur-Ellis in high value specialty crops. Launch plans are in progress to introduce the product in the second half of 2023, after registration by the EPA and in key USA states. Thereafter, a new, liquid formulation of PHC949 optimised for use as seed treatment in row crops such as corn and soybeans is expected to be approved in late 2024. USA field trials testing PHC949 relative to established competitor products shows outstanding control of nematode pests in a variety of crops. For example, in peppers, PHC949 increased marketable yield by about 3,265 lbs/acre, worth an extra $2,070/acre at current prices. Field trials are also under way, demonstrating the value of PHC949 in soybeans and other crops in the USA based on foliar and seed treatment applications. The Group expects long-term global sales of products based on PHC949 to reach into the tens of millions of dollars and become a significant value driver for the Group. Work is also continuing in the USA in conjunction with Wilbur-Ellis to develop our leading biostimulant peptides, PHC414 and PHC404. BRAZIL In Brazil, further development work is under way to build on the successful 2021 launch of Saori™ for the treatment of Asian Soybean Rust. The Company plans to register a new liquid formulation of Saori™, to complement the granular formulation launched in 2021. An application is expected to be submitted to the Brazilian Ministry of Agriculture, Livestock and Food Supply ("MAPA") in mid-2022, with approval targeted for mid-2023. The Group continues to invest in Saori™ to extend the label claims to cover plant diseases like Brown Spot and Target Spot. In 2023, the Group also plans to submit new registrations in Brazil for the foliar use of PHC279 for treating diseases affecting sugarcane and coffee. Also in Brazil, studies are under way to support the registration of PHC949 for preventing nematode damage in soybeans. This application is expected to be submitted to MAPA in late 2022, with the expectation of being granted registration by the end of 2023. REST OF WORLD Working with various multinational crop protection companies, opportunities to deploy PHC279, PHC949 and other PREtec products are being actively explored in China, Taiwan, Vietnam, Spain, Chile, and the UK. While the regulatory route to market and associated costs, timelines, and opportunities vary from country to country, the Group will invest selectively in these markets wherever these opportunities are large enough to justify the required investment. PREtec - Targeting markets with value greater than $5 billion
2012-14 Discovery • Build lab and team • >800 peptides synthesised and screened in lab • Mode of action studies 2015-17 IP secured • Identified six lead products • Initial field trials • >50 patents filed; first patents granted in 2020 2017-19 Efficacy confirmed • Testing in multiple crops in the USA, Brazil and the EU • PHC279 emerging as first champion • Low-cost production process in lab 2020-21 Regulator submission first launch • Saori™ (PHC279) launch in Brazil H2 2021 • Agreement for commercial scale low COGS production • PHC949 USA registration submission • JDA with Wilbur-Ellis in USA specialty crops 2022-25 Accelerate launches • Achieve USA and Brazil registrations of PHC279 and PHC949 • Fourth quarter 2022 launch of PHC279 with Wilbur-Ellis in the USA • Further JDAs and partnerships for multiple launches • Product development in Europe
Financial summary Jeffrey Hovey, Chief Financial Officer Continued control of expenses and reduced working capital
A summary of the financial results for the year ended 31 December 2021 with comparatives for the previous financial year is set out below:
Revenues Revenues in 2021 increased by 28% to $8.4 million (2020: $6.6 million). On a constant currency basis revenue increased 24% or $1.6 million driven by strong growth in the sugar cane and the corn and specialty markets in Brazil and the USA, respectively. The gross margin increase to 59% (2020: 56%) is due to increased Harpin αβ sales into the Americas. Harpin αβ sales increased 55% to $6.0 million (2020: $3.9 million). Third-party revenue decreased 11% to $2.4 million (2020: $2.6 million) due to reduced plantings in the Mexican specialty market. The Group has three separate reporting segments as set out below. The Group's revenue, gross margin and LBITDA are weighted towards the second half of the financial year. Revenue in the 1st half of the year is 40%, with the remainder being recognized in the second half. Americas This segment includes activities in both North and South America but is exclusive of Mexico. Revenue in the Americas segment increased 77% (80% in constant currency) to $3.9 million (2020: $2.2 million). The increase in revenue was due to further expansion into the specialty crop and corn markets through our partner Wilbur-Ellis and another large USA distributor. Revenue in the Americas is predominantly from Harpin αβ sales. Rest of world Revenue in the Rest of World segment increased 31% (26% in constant currency) to $1.6 million (2020: $1.2 million). The increase was primarily due to a sales increase of 33% (28% in constant currency) in Spain due to continued growth into the citrus market and expansion into the glasshouse market. Revenue in the Rest of World segment is predominantly from Harpin αβ sales. Mexico A significant portion of the Group's revenue comes from Mexico. Revenue from the Mexican segment decreased 8% (12% in constant currency) to $3.0 million (2020: $3.2 million). This was primarily due to decreased export demand for fruits and vegetables and reduced plantings in the specialty market. Revenue in Mexico includes sales of Harpin αβ and third-party products. The gross margin in Mexico for Harpin αβ and third-party products are 70%+ and 40%+, respectively. Gross margin Gross margin increased to 59% (2020: 56%). The increase was primarily due to increased sales of Harpin αβ in North America and Brazil. Harpin αβ globally consistently achieves a gross margin of 70%+. Operating expenses The Group raised equity to help accelerate our product launches, which caused expenses to increase to $9.6 million (2020: $7.3 million). The main contributors were increased sales and marketing spend at $3.7 million (2020: $2.9 million) to drive additional commercial sales in Brazil and the USA, increased PREtec spend at $3.0 million (2020: $2.3 million) to support our PREtec product launches and increased administration costs to support our consolidation efforts. Non-cash unallocated corporate expenses increased $1.6 million to $1.8 million (2020: $0.2 million). The increase was attributable to the forex loss in the value of Sterling loans from our UK subsidiary due to the appreciation of the Pound (2020: forex gain). Adjusted LBITDA, a non-GAAP measure, increased by $1.3 million to $4.6 million (2020: $3.3 million) primarily due to improved gross profit of $1.3 million offset by increased spend in sales and marketing of $0.8 million, PREtec of $0.7 million, and administration of $0.7 million. * Adjusted LBITDA: loss before interest, tax, depreciation, amortisation, share-based payments and intercompany foreign exchange.
Balance sheet At 31 December 2021 and 2020, investments and cash and cash equivalents were $9.2 million and $4.1 million respectively. Cash remains a primary focus for the Group. Inventory ($2.1 million) decreased $1.4 million due to increased consumption and improved purchasing patterns. Trade accounts receivable ($3.4 million) increased $0.6 million due to increased sales in the USA market in the fourth quarter versus the prior year. Trade payables ($1.2 million) were comparable to the prior year ($1.3 million). Translation of the results of foreign subsidiaries for inclusion within the consolidated Group results resulted in an exchange gain of $0.5 million recorded within other comprehensive income and foreign exchange reserves (2020: loss of $1.2 million). Cash flow and liquidity The Company successfully raised £6.6 million ($9.1 million) through the issuance of new ordinary shares in March 2021. Net cash used in operations was $3.2 million (2020: $2.5 million). The increase is due to increased losses offset by an improvement in working capital primarily by reduced inventory through increased product consumption and improvement inventory management. Net cash used by investing was $5.4 million (2020: $1.2 million). The Group holds surplus cash in several bond and money market funds. The movement in these funds was used to further invest in the PREtec business and fund the Commercial business. Net cash provided by financing activities was $8.6 million (2020: $4.2 million). The increase was primarily due to the March 2021 equity raise of $9.1 million. Going concern In assessing whether the going concern basis is appropriate for preparing the 2021 annual report, the Directors have utilised the Group's detailed forecasts, which take into account its current and expected business activities, its cash and cash equivalents and its investments balance of $9.2 million. The principal risks and uncertainties the Group faces and other factors impacting the Group's future performance were considered. The Directors confirm that they have a reasonable expectation that the Group will have adequate resources to continue in operational existence for the next 12 months from approval of these financial statements and accordingly these financial statements are prepared on a going concern basis, with no material uncertainty over going concern. Analysis of the going concern position is detailed in the Directors' Report in the Annual Report and note 1 to this announcement.
Consolidated statement of comprehensive income for the year ended 31 December 2021
The accompanying notes are an integral part of these condensed consolidated financial statements
Consolidated statement of financial position at 31 December 2021
The accompanying notes are an integral part of these condensed consolidated financial statements
Consolidated statement of changes in equity for the year ended 31 December 2021
The accompanying notes are an integral part of these condensed consolidated financial statements
Consolidated statement of cash flows for the year ended 31 December 2021
The accompanying notes are an integral part of these condensed consolidated financial statements
Notes to the condensed consolidated financial statements for the year ended 31 December 2021 1. Basis of preparation The financial information set out in this document does not constitute the Group's statutory accounts for the years ended 31 December 2020 or 2021. Statutory accounts for the years ended 31 December 2020 and 31 December 2021, which were approved by the directors on 11 May 2022, have been reported on by the Independent Auditor. The Independent Auditor's Reports on the Annual Report and Financial Statements for each of 2020 and 2021 were unqualified, did not draw attention to any matters by way of emphasis, and did not contain a statement under 498(2) or 498(3) of the Companies Act 2006.
Statutory accounts for the year ended 31 December 2020 have been filed with the Registrar of Companies. The statutory accounts for the year ended 31 December 2021 will be delivered to the Registrar of Companies in due course and will be posted to shareholders shortly, and thereafter will be available from the Group's registered office at c/o DWF LLP, 1 Scott Place, 2 Hardman Street, Manchester, England, M3 3AA and from the Group's website: https://www.planthealthcare.com/investors
The financial information set out in these results has been prepared using the recognition and measurement principles of International Accounting Standards, International Financial Reporting Standards and Interpretations in conformity with UK adopted international accounting standards. The accounting policies adopted in these results have been consistently applied to all the years presented and are consistent with the policies used in the preparation of the financial statements for the year ended 31 December 2020, except for those that relate to new standards and interpretations effective for the first time for periods beginning on (or after) 1 January 2020. There are deemed to be no new standards, amendments and interpretations to existing standards, which have been adopted by the Group, that have had a material impact on the financial statements. Reporting currency While the functional currency of the parent company is Sterling, the Group's financial statements have been presented in US Dollars. The Directors believe this better reflects the underlying nature of the business, primarily due to the USA being the country whose competitive forces and regulations impact this business. The exchange rates used for translation are as reported below:
Going concern In assessing whether the going concern basis is an appropriate basis for preparing the 2021 annual report, the Directors have utilized detailed forecasts which take into account the Group's current and expected business activities, its cash and cash equivalents balance and investments of $9.2 million as shown in its balance sheet at 31 December 2021, the principal risks and uncertainties the Group faces and other factors impacting the Group's future performance. The consolidated financial statements have been prepared on a going concern basis. The Directors have, at the time of approving the financial statements, a reasonable expectation that the Group has adequate resources to continue in operational existence for the foreseeable future. The Covid-19 pandemic has so far had limited impact on our business and the Board believes that the business is able to navigate through the continued impact of the Covid-19 pandemic and any macroeconomic impact of the ongoing situation in Ukraine due to the strength of its customer proposition and statement of financial position and the net cash position of the Group. The current economic conditions continue to create uncertainty, particularly over: (a) the level of customers and potential customer engagement; and (b) the level of new sales to new customers. The pandemic and situation in Ukraine have continued to have impacts economically, with potential for causing delays in contract negotiations and/or cancelling of anticipated sales and an uncertainty over cash collection from certain customers. As a consequence, various sensitivity analyses have been performed to reflect a variety of possible cash flow scenarios and also to consider the likelihood of this scenario occurring. Overall, these cash flow forecasts, which cover a period of at least 12 months from the date of approval of the financial statements, foresee that the Group will be able to operate within its existing facilities. Nevertheless, there is a risk that the Group will be impacted more than expected by reductions in customer confidence. If sales and settlement of existing debts are not in line with cash flow forecasts, the Directors have the ability to identify cost savings if necessary, to help mitigate the impact on cash outflows. Having assessed the principal risks and the other matters discussed in connection with the going concern statement, the Directors have a reasonable expectation that the Group has adequate resources to continue in operational existence for the foreseeable future. For these reasons, they continue to adopt the going concern basis of accounting in preparing the financial information. 2. Critical accounting estimates and judgements In preparing its financial statements, the Group makes certain estimates and judgements regarding the future. Estimates and judgements are continually evaluated based on historical experience and other factors, including expectations of future events that are believed to be reasonable under the circumstances. In the future, actual experience may differ from estimates and assumptions. The estimates and judgements that have a risk of causing a material adjustment to the carrying amounts of assets and liabilities within the next financial year are discussed below. Impairment of goodwill The Group tests whether goodwill has suffered any impairment on an annual basis. The recoverable amount is determined based on value-in-use calculations. The use of this method requires the estimation of future cash flows and the choice of a discount rate in order to calculate the present value of the cash flows. Actual outcomes may vary. Impairment of intangible assets (excluding goodwill) At the end of the financial period, the Group reviews the carrying amounts of its definite lived intangible assets to determine whether there is any indication that those assets have suffered any impairment loss. If any such indication exists, the recoverable amount of the asset is estimated to determine the extent of the impairment loss (if any). Recoverable amount is the higher of fair value less costs to sell and value in use. In assessing the value in use, the estimated future cash flows are discounted to their net present value using a pre-tax discount rate that reflects current market assessments of the time value of money and the risks specific to the asset. If the recoverable amount of an asset is estimated to be less than its carrying amount, the carrying amount of the asset is reduced to its recoverable amount. An impairment loss is recognized immediately within administrative expenses in the consolidated statement of comprehensive income. Revenue The Group recognizes revenue at the fair value of consideration received or receivable. Sales of goods to external customers are at invoiced amounts less value-added tax or local tax on sales. The Group currently generates revenue solely within its Commercial business through the sale of its proprietary and third-party products. When the Group makes product sales under contracts/agreements these will frequently be inclusive of rebate/support payments or a financing component where judgement can be required in the assessment of the transaction price. Recoverability of trade receivables The Group applies both the simplified and general approaches under IFRS 9 to measure expected credit losses using a lifetime expected credit loss provision for trade receivables. Under the simplified approach, expected credit losses on a collective basis, trade receivables are grouped based on credit risk and ageing. Given the Group has a low history of default, limited judgement is required for trade receivables in this grouping. The Group then separately reviews those receivables with payment terms over 180 days using the general approach. Under this approach judgements are required in the assessment of the risk and probability of credit losses and the quantum of the loss in the event of a default. The Group has debtors with a gross value (before provisioning but after the assessment of financing components) of $0.7 million within this grouping. 3. Revenue
The following table gives an analysis of revenue according to sales with payment terms of less than or more than 180 days. Year to 31 December 2021
Year to 31 December 2020
4. Operating loss
* Under the US Department of Treasury CARES Act, the Company was eligible for the Paycheck Protection Program ("PPP") loan. All provisions of the loan were satisfied as laid out in the CARES Act, making the Company eligible for a 100% forgiveness of the $289,000 loan received.
5. Segment information The Group's CODM views, manages and operates the Group's business segments according to its strategic business focuses - Commercial and PREtec. The CODM further analyses the results and operations of the Group's Commercial business on a geographical basis; therefore the Group has presented separate geographic segments within its Commercial business as follows: Commercial - Americas (North and South America, other than Mexico); Commercial - Mexico; and Commercial - Rest of World. The Rest of World segment includes the results of the United Kingdom and Spanish subsidiaries, which together operate across Europe and South Africa. The Group's Commercial segments are focused on the sale of biological products and are the Group's only revenue generating segments. The Group's PREtec segment is focused on the research and development of the Group's PREtec platform. Below is information regarding the Group's segment loss information for the year ended:
* Revenue from one customer within the Americas segment totaled $1,350,000, or 16% of Group revenues. Revenue from one customer within the Mexico segment totaled $1,204,000, or 14% of Group revenues. Revenue from one customer within the Americas segment totaled $1,066,000, or 13% of Group revenues. Revenue from one customer within the Americas segment totaled $994,000, or 12% of Group revenues. ** These amounts represent public company expenses for which there is no reasonable basis by which to allocate the amounts across the Group's segments. *** Includes net share-based payment expense of $240,000 attributed to corporate employees who are not directly affiliated with any of the Commercial or PREtec segments.
* Revenue from one customer within the Americas segment totaled $950,000, or 14% of Group revenues. Revenue from one customer within the Mexico segment totaled $1,293,000, or 20% of Group revenues. ** Under the US Department of Treasury CARES Act, the Company was eligible for the Paycheck Protection Program ("PPP") loan. All provisions of the loan were satisfied as laid out in the CARES Act, making the Company eligible for a 100% forgiveness of the $289,000 loan received. *** These amounts represent public company expenses for which there is no reasonable basis by which to allocate the amounts across the Group's segments. **** Includes net share-based payment expense of $130,000 attributed to corporate employees who are not directly affiliated with any of the Commercial or PREtec segments.
Segment assets include all operating assets used by a segment and consist principally of operating cash, receivables, inventories, property, plant and equipment and intangible assets, net of allowances and provisions. Segment liabilities include all operating liabilities and consist principally of trade payables and accrued liabilities. Geographic information The Group operates in five principal countries - the United Kingdom (country of domicile), the USA, Mexico, Spain and Brazil. The Group's revenues from customers by location of operation are detailed below:
The Group's non-current assets by location of assets are detailed below:
6. Loss per share Basic loss per ordinary share has been calculated on the basis of the loss for the year of $6,304,000 (2020: loss of $3,224,000) and the weighted average number of shares in issue during the period of 292,204,361 (2020: 245,268,691). Equity instruments of 26,770,302 (2020: 22,953,802), which include share options, and the 2017 Employee Share Option Plan could potentially dilute basic earnings per share in the future have been considered but not included in the calculation of diluted earnings per share because they are anti-dilutive for the periods presented. This is due to the Group incurring a loss on operations for the year.
7. Intangible assets
The intangible asset balances have been tested for impairment using discounted budgeted cash flows of the relevant cash generating units. For the years ended 31 December 2020 and 2021, cash flows are projected over a five-year period with a residual growth rate assumed at 0%. For the years ended 31 December 2020 and 2021, a pre-tax discount factor of 14.5% and 15.2% has been used over the forecast period. Goodwill Goodwill comprises of a net book value of $1,432,000 related to the 2007 acquisition of the assets of Eden Bioscience and $188,000 related to an acquisition of VAMTech LLC in 2004. The entire amount is allocated to Harpin αβ, a cash generating unit within the Commercial - Americas segment. No impairment charge is considered necessary, and no reasonable possible change in key assumptions used would lead to an impairment in the carrying value of goodwill. Licenses and registrations These amounts represent the cost of licenses and registrations acquired in order to market and sell the Group's products internationally across a wide geography. These amounts are amortized evenly according to the straight-line method over the term of the license or registration. Impairment is reviewed and tested according to the method expressed above. Licences and registrations have a weighted average remaining amortisation period of one year. No impairment charge is considered necessary, and no reasonable possible change in key assumptions used would lead to an impairment in the carrying value of licences and registrations.
8. Property, plant and equipment
9. Trade and other receivables
The trade receivable current balance represents trade receivables with a due date for collection within a one-year period. The other receivable non-current balance represents lease deposits. The Group applies the IFRS 9 simplified approach to measuring expected credit losses for sales contracts with 180 days or fewer payment terms. To measure expected credit losses on a collective basis, trade receivables and contract assets are grouped based on similar credit risk and ageing. The expected loss rates are based on the aging of the receivable, past experience of credit losses with customers and forward-looking information. An allowance for a receivable's estimated lifetime expected credit losses is first recorded when the receivable is initially recognized, and subsequently adjusted to reflect changes in credit risk until the balance is collected. In the event that management considers that a receivable cannot be collected, the balance is written off. Sales contract receivables provided on terms greater than 180 days are at first discounted to recognize the financing component of the transaction and then assessed using the "general approach". Under this approach, the Group models and probability weights a number of scenarios based on their assessment of the credit risk and historical expected losses.
The receivables considered under the general approach relate to one customer in the Americas segment and one customer in the Rest of World segment. The key considerations in the assessment of the provision were the probability of default, expected loss in the event of default and the exposure at the point of default. The maximum exposure to credit risk at the reporting date is the fair value of each class of receivables set out above. Movements on the provision for impairment of trade receivables are as follows:
The net value of trade receivables for which a provision for impairment has been made is $0.7 million (2020: $0.6 million). The following is an analysis of the Group's trade receivables, both current and past due, identifying the totals of trade receivables which are not yet due and those which are past due but not impaired.
10. Cautionary statement This document contains certain forward-looking statements relating to Plant Health Care plc (the "Group"). The Group considers any statements that are not historical facts as "forward-looking statements". They relate to events and trends that are subject to risk and uncertainty that may cause actual results and the financial performance of the Group to differ materially from those contained in any forward-looking statement. These statements are made by the Directors in good faith based on information available to them and such statements should be treated with caution due to the inherent uncertainties, including both economic and business risk factors, underlying any such forward-looking information.
This information is provided by RNS, the news service of the London Stock Exchange. RNS is approved by the Financial Conduct Authority to act as a Primary Information Provider in the United Kingdom. Terms and conditions relating to the use and distribution of this information may apply. For further information, please contact rns@lseg.com or visit www.rns.com. RNS may use your IP address to confirm compliance with the terms and conditions, to analyze how you engage with the information contained in this communication, and to share such analysis on an anonymized basis with others as part of our commercial services. For further information about how RNS and the London Stock Exchange use the personal data you provide us, please see our Privacy Policy.
END
Plant Health Care offers products to improve the health, vigor and yield of major field crops such as corn, soybeans, potatoes and rice, as well as specialty crops such as fruits and vegetables. We operate globally through subsidiaries, distributors and supply agreements with major industry partners. Our innovative, patent-protected biological products help growers to protect their crops from stress and diseases, and to produce higher quality fruit and vegetables, with a favorable environmental profile. Contact DetailsJeffrey Hovey +1 919-926-1600 Company Websitehttps://www.planthealthcare.com/ News Source: News Direct
14.05.2022 Dissemination of a Corporate News, transmitted by DGAP - a service of EQS Group AG. |
|||||||||||||||||||||||||||||||||||||||||||||||||||||||||||||||||||||||||||||||||||||||||||||||||||||||||||||||||||||||||||||||||||||||||||||||||||||||||||||||||||||||||||||||||||||||||||||||||||||||||||||||||||||||||||||||||||||||||||||||||||||||||||||||||||||||||||||||||||||||||||||||||||||||||||||||||||||||||||||||||||||||||||||||||||||||||||||||||||||||||||||||||||||||||||||||||||||||||||||||||||||||||||||||||||||||||||||||||||||||||||||||||||||||||||||||||||||||||||||||||||||||||||||||||||||||||||||||||||||||||||||||||||||||||||||||||||||||||||||||||||||||||||||||||||||||||||||||||||||||||||||||||||||||||||||||||||||||||||||||||||||||||||||||||||||||||||||||||||||||||||||||||||||||||||||||||||||||||||||||||||||||||||||||||||||||||||||||||||||||||||||||||||||||||||||||||||||||||||||||||||||||||||||||||||||||||||||||||||||||||||||||||||||||||||||||||||||||||||||||||||||||||||||||||||||||||||||||||||||||||||||||||||||||||||||||||||||||||||||||||||||||||||||||||||||||||||||||||||||||
| Language: | English |
| Company: | Plant Health Care |
| United States | |
| ISIN: | GB00B01JC540 |
| EQS News ID: | 1352609 |
| End of News | DGAP News Service |
|
|
1352609 14.05.2022